Ordinarily, I try and do my best to match up each problem with a solution. You’re paying for this stuff–or at least investing your time reading it–and I ought to do what I can to present a zesty, crunchy conclusion.
When are pitchers most susceptible to injury? Well, always, but especially before age 23. What type of hitters reap the most benefit from Coors Field? Strikeout-heavy hitters like Preston Wilson. Are my feet growing bigger? No. Based on the available evidence, my socks are shrinking in the dryer (publication pending).
But this article is going to be a little bit different. I hope you’ll excuse me for doing a bit of thinking out loud. I hope that you’ll write me, tell me that I’m a moron, or that I’ve got something here, or a little bit of both. Today, boys and girls, we’re going to talk about replacement level.
Truth be told, replacement level has always annoyed me. As much as I respect the work of folks like Keith Woolner–and I think Keith’s work on replacement level is the best out there–and as much as I’ve used various permutations of replacement level in my own work, I’ve always found the concept to be something of a necessary evil. It’s often convenient to have a precise definition of replacement level on hand, be it that embedded in WARP or VORP or (gasp!) Win Shares, but there are times when precision can be a substitute for meaning. The exactness of an answer can obscure its pertinence to the question (file under: Dirty Consultant Tricks).
Replacement level, fundamentally, is an economic concept, and represents the threshold at which a comparable player can be acquired at little or no cost. That definition is pretty much the consensus one, and I don’t mean to dispute it. But I do think that we need to consider a bit more carefully what is meant by “little or no cost.” In particular, I think there’s a temporal component to the cost of player acquisition that has been lost here.
Take the extreme case. Jorge Posada tears his hamstring in batting practice, less than an hour before game time. Let’s further assume that Jeff Weaver is not the scheduled pitcher, so at least some balls will not be hit by the opposition and the Yankees will need someone to catch them. Who can the Yankees insert in his place?
- John Flaherty. He’s got a .220 EqA–actually ahead of where PECOTA projected him–which by most definitions is below replacement level, even for a catcher.
- Flaherty, John.
- That Flaherty Show.
- To the six readers who suggested Todd Zeile: please see a licensed professional.
In the very short run, the Yankees are stuck with a below replacement level player starting the game for them. Now, you might ask why John Flaherty is on the roster to begin with, but that’s missing the point. The distribution of baseball talent isn’t perfectly efficient. In the short run, it isn’t particularly close to it.
The Yankees’ options expand, however, with their time horizon. The first flight out of CMH leaves before six the next morning, and Michel Hernandez, the other catcher on the 40-man roster, is a somewhat more appealing alternative. His .223 EqA isn’t a whole lot better than Flaherty’s, but there’s some upside there if you can wait for him.
But these being the Yankees, chances are they’re going to look outside the organization if Posada is injured for any length of time. If the injury occurs in spring training, there will probably be some desirable alternatives on the waiver wire. If it occurs in August, probably not–pretty much everyone is going to be playing ball by that point, or working on their golf game and beer belly.
Instead, the Yankees can try and make a trade. If they’re patient enough, they’ll eventually get a fair deal. But in the short term, some teams will try and exploit them, knowing they’re working through an injury situation and competing in tight divisional race. Others won’t want to give up their own catchers, or won’t see eye-to-eye with the Yankees on player value. With only 30 spokes on the wheel, each with their respective hang-ups, the market for baseball players isn’t especially liquid, and particularly once the season is underway. This isn’t Baseball Mogul, and there are real and psychological transaction costs involved in making trade offers.
If, on the other hand, Posada’s injury had occurred during the off-season, the Yankees would have a much fuller set of options. They could sign a free agent, and with other teams looking to fill comparable holes at other positions, the trade market would be more robust. While the player they acquired might not come free of charge, they’d be in a better position to maximize their utility function by considering a broader array of alternatives.
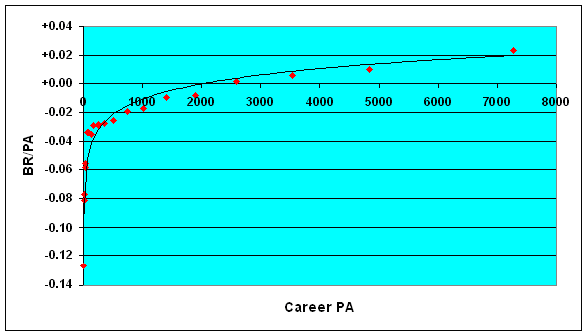
Here, let’s look at some data. In the table below, I’ve compiled the performance of all non-pitchers whose careers were completed between the years 1973 and 1992–an era of relative stability in run scoring levels. The players are grouped by the number of plate appearances that they compiled during the period, ranging from one all the way up to 10,184 (Dave Parker). The metric that I’ve used here is Batting Runs per Plate Appearance (BR/PA), which has the distinct advantage of being reasonably simple to calculate.
Min PA  Max PA  n       Mean PA   BR/PA
1       5       53      3.8     -0.1268
6       10      41      8.6     -0.0812
11      20      46      16.7    -0.0774
21      30      49      26.3    -0.0553
31      50      48      41.2    -0.0587
51      70      54      60.7    -0.0343
71      110     49      91.6    -0.0342
111     150     51      130     -0.0354
151     200     39      176     -0.0291
201     300     59      253     -0.0283
301     400     44      355     -0.0277
401     600     58      506     -0.0253
601     900     49      738     -0.0196
901     1200    50      1020    -0.0175
1201    1600    52      1409    -0.0096
1601    2200    49      1902    -0.0083
2201    3000    45      2595    +0.0015
3001    4200    48      3536    +0.0061
4201    5500    49      4835    +0.0102
5501    10184   24      7271    +0.0231
BR/PA is designed such that a league-average performance receives a value of zero. It’s interesting that you have to go so far down the chart–a career of around 2500 PA, or four or five full seasons–before the positive scores start to kick in. As Bill James pointed out during his Abstract days, the talent distribution in baseball is asymmetrical; the vast majority of players who appear at some point on a major league roster turn in a below-average performance, but the above-average players receive so much more playing time that the equilibrium is maintained.
In any event, the relationship between quality and quantity is quite strong:
There are a lot of stories you can tell around data like this, but one thing that seems clear is that players who fill in for very short stretches of time tend to be disproportionately bad. Although there are selection effects to contend with–it’s likely that many of the players on the left-hand side of the curve are performing below their “true” levels of production–I suspect the pattern also reflects the inefficiencies that teams face in coming up with short-term replacements when unexpected contingencies arrive. The alternatives that a team has to acquire a player at little or no cost are often inadequate in the short run; over the longer term, we can expect the market to perform more efficiently.
The pattern sketched out by the data points is not only a strong one, but also highly logarithmic. (If a mouse pointer clicks the “back” button and there’s no one to hear it, what sound does it make?). The best fit line–outlined in black here–is modeled by the following equation:
BR/PA = 0.0154 * ln(PA) – 0.117
That formula isn’t particularly useful in and of itself, but it brings up an interesting way to calculate value above replacement. (Just to warn you, here’s where we’ve gotten into “thinking out loud” territory). If, as in the figure below, we plot a given player’s PA and BR/PA, we can assign him positive value for the space he occupies above the best fit line.
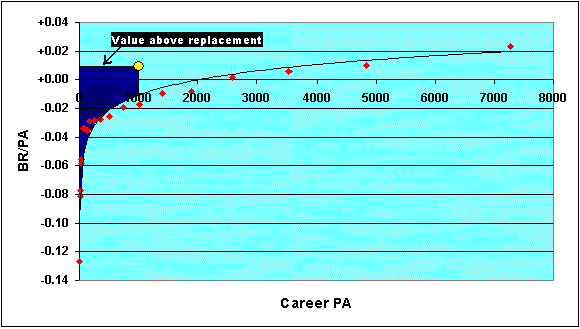
Graphically speaking, value above replacement is represented by the dark blue region. Intuitively speaking, we’ve reflected the notion that the longer the period of time that a player is in the lineup for, the higher standard we ought to apply in evaluating his performance. A player that performs somewhat below average for a couple of weeks? It’s easy to envision a scenario–say as a quick-fix injury replacement–under which that player has value. But a player that performs somewhat below average for a number of seasons consecutively? It’s hard to imagine that such a player will accumulate much of that playing time with a championship-caliber team. Over the long run, the number of opportunities to improve upon such a player are many, and the opportunity cost of settling for such mediocrity is high.
For the mathematically inclined, we can evaluate the player’s value above replacement by making use of an integral. In order to preserve the theoretical possibility that I ever get laid again, I should mention that I didn’t know the integral for ln(x) off-hand. But several of my BP colleagues–we won’t name names here–responded with the solution just minutes after I had sent out the pertinent e-mail. Skipping a bunch of steps, we come up with the following formula for what I’ll call, for now, Progressive Runs Above Replacement (“PRAR”):
PRAR = BR – PA * (.0154 ln(PA) – .1324)
Like other replacement-level formulas, PRAR includes a component for quality of performance (Batting Runs), and another for quantity (Plate Appearances). The trick is that it’s structured in such a way that replacement level gets progressively higher as the player accumulates more playing time.
While I’m sure that the PRAR formula can be improved upon–there are more precise measures of offensive performance than Batting Runs, and we haven’t adjusted for a player’s position–the form of the equation has some fascinating implications. In situations in which we’re focused on the short-term–say, assessing the advantage to be gained from a mid-season player acquisition, or the cost of an unexpected injury–we ought to set the replacement-level bar low.
Conversely, when we’re focused on the longer term, and the talent market has had a chance to behave efficiently, outstanding rather than merely adequate performance is at a premium. In Hall of Fame debates, we’ll want to shift a little bit of emphasis from career to peak performance. In evaluating strategies for the amateur draft, with our time horizon several years in advance, we’ll want to give a little bit more credence to a high-risk, high-upside approach.
More commonly, replacement value has been invoked to evaluate performance over the course of a particular season. When this is the period that we’re focused on, PRAR ties quite closely with existing metrics like VORP. Assuming a league environment of 800 runs per team and 650 PA per player season, the PRAR formula implies that a replacement-level player produces about 76% as many runs as an average player, an answer well within the 75%-85% range that Keith Woolner’s research has established. Comparing the 2002 league leaderboards for VORP and PRAR produces a ton of overlap, with most of the differences accounted for by the crudeness of a PRAR measure that is not adjusting for park or position effects:
2002 League Leaders, PRAR
Player                   PA      PRAR
Bonds, Barry            612     149.0
Thome, Jim              613     103.1
Giles, Brian            644     100.2
Giambi, Jason           689      98.8
Rodriguez, Alex         725      95.7
Guerrero, Vladimir      709      95.7
Helton, Todd            667      91.1
Berkman, Lance          692      86.9
Ramirez, Manny          518      86.2
Sosa, Sammy             666      85.4
2002 League Leaders, VORP
Player                   PA      VORP
Bonds, Barry            612     146.6
Rodriguez, Alex         725      90.9
Thome, Jim              613      86.9
Giambi, Jason           689      84.0
Kent, Jeff              682      83.8
Giles, Brian            644      81.6
Ramirez, Manny          518      74.3
Williams, Bernie        699      71.6
Guerrero, Vladimir      709      71.3
Soriano, Alfonso        740      70.4
Upon reflection, this result should not be surprising. VORP was designed based on historical evaluation of player performance on a season-by-season basis. But at the risk of sounding self-aggrandizing, I think it’s possible that VORP is just one special case in a larger framework for assessing player performance. The efficiency with which a player can be replaced is time-dependent, and if the period of our evaluation changes, so too should be the point at which replacement level is established.
A zesty, crunchy conclusion? Perhaps, perhaps not, but at least it’s something to chew on.
Thank you for reading
This is a free article. If you enjoyed it, consider subscribing to Baseball Prospectus. Subscriptions support ongoing public baseball research and analysis in an increasingly proprietary environment.
Subscribe now