This week’s question comes from Nate Calvin, who also happens to be an old
college buddy of mine:
Sandy Alderson is in hot water for trying to get the umps to drop game pitch
counts from 285 to 270 by calling more strikes. I believe pitchers average a
little over five pitches per out, so three extra strikeouts a game would
easily cover the difference. What’s the current strike percentage, and based
on the situational tables, what strike percentage would be required to meet
Sandy’s target?(Suspected result: the necessary change does not impact the character of the
game whatsoever.)
This has certainly been a hot topic lately, and the BP staff has been
getting many questions about it. I drew the short straw, so I get to tackle
this one.
I’m going to approach the question a little differently that Nate has
suggested. I’m going to look at all the games so far this year, and break
them down by total pitches thrown. More specifically, I’m going to exclude
extra-inning games and rain-shortened games, and just look at
"normal" length games of between 17 and 18 total pitched innings.
Let’s look at some selected averages for such games so far this year:
NP_RANGE  Games   Strike%    RA  AVGTIME  BFP/G    AVG  OBP  SLG  OPS  AVG_NP
All        1139    62.49%  4.95    175.9     77   .260 .330 .422  752  285.29
Some of the non-obvious headings are:
- NP_RANGE is the pitch counts that a game had to have in order to
be considered (e.g., 250-259). In this case, "All" means all
qualifying games. - Strike% is the percentage of all pitches that were strikes
- AVGTIME is the average length of a game, in minutes
- BFP/G is the average number of batters faced by each team’s
pitching staff in a game. - AVG_NP is the average number of pitches thrown per game for this
set of games.
In analyzing the different ranges of pitch counts, I’m going to make an
assumption (which may or may not be a good one), that changing the
major-league average pitch count total will lead to overall results
comparable to those games that are already in that range. In other words, to
see what happens when the average pitch counts of all games drops to 270,
look at current games in which about 270 pitches were thrown. I’ll use
ranges spanning 10 pitches (e.g., 250-259 pitches, 260-269 pitches, etc.) as
the different sets of games. If the assumption is at least plausible, then
the averages for the 280-289 pitch count range should be reasonably close to
the averages for all games:
NP_RANGE  Games   Strike%    RA  AVGTIME  BFP/G    AVG  OBP  SLG  OPS  AVG_NP
ALL        1139    62.49%  4.95    175.9     77   .260 .330 .422  752  285.29
280-289     120    62.70%  5.04    176.2     77   .264 .333 .422  755  286.83
It looks like looking only at games around the mean pitch count (NP_RANGE =
280-289) gives a decent approximation to the rates of the entire data set
(ALL). If this holds true throughout the range of pitch counts we want to
examine, then to see what baseball would be like if league-wide averages
were driven down to 270 NP/G, we can look at what happens in games around
270 pitches.
|
|
|
|
|
|
|
|
|
|
|
|
|
|
|
|
|
|
|
|
|
|
|
|
|
|
|
|
|
|
|
|
|
|
|
|
|
|
|
|
|
|
|
|
|
|
|
|
|
|
|
|
|
|
|
|
|
|
|
|
|
|
|
|
|
|
|
|
|
|
|
|
|
|
|
|
|
|
|
|
|
|
|
|
|
|
|
|
|
|
|
|
|
|
|
|
|
|
|
|
|
|
|
|
|
|
|
|
|
|
|
|
|
|
|
|
|
|
|
|
|
|
|
|
|
|
|
|
|
|
|
|
|
|
|
|
|
|
|
|
|
|
|
|
|
|
|
|
|
|
|
|
|
|
|
|
|
|
|
|
|
|
|
|
|
|
|
|
|
|
|
|
|
|
|
|
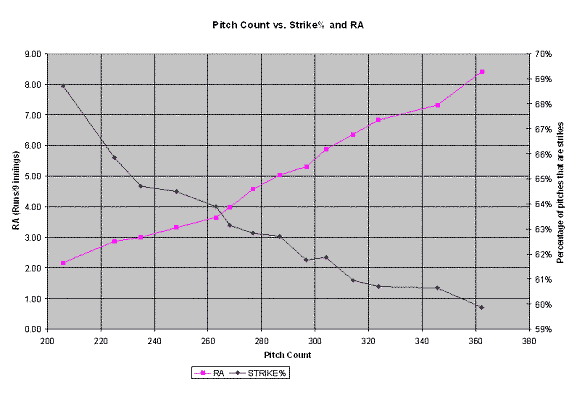
First, let’s notice that there is a direct correlation between the number of
pitches thrown, and the percentage of pitches thrown for strikes.
Presumably, calling more strikes would indeed lower pitch counts. Next,
notice that run scoring rises as pitch counts rise. Neither phenomenon is
particularly unexpected, but the strength of the relationship may not be
obvious until you see the data for yourself. A chart makes the point more
strongly:

Run scoring rises roughly linearly with total pitch count, while the
relationship between pitch count and strike percentage looks slightly
nonlinear, but again clearly showing the intuitive result that higher pitch
counts are associated with throwing fewer strikes.
Returning to Nate’s question and suspected result, the implication of this
analysis is that reducing overall pitch counts by increasing the strike
percentage to the required level would actually have a significant impact on
the game. Interpolating from the table given above, to obtain a 270 average
pitch-count, the percentage of strikes called would need to increase from
the current 62.5% to about 63%. Half a percent sounds like a small amount,
but the impact is significant. Run scoring would decrease from the current
4.95 RA to an expected 4.10 RA, a level not seen since the early 1990s.
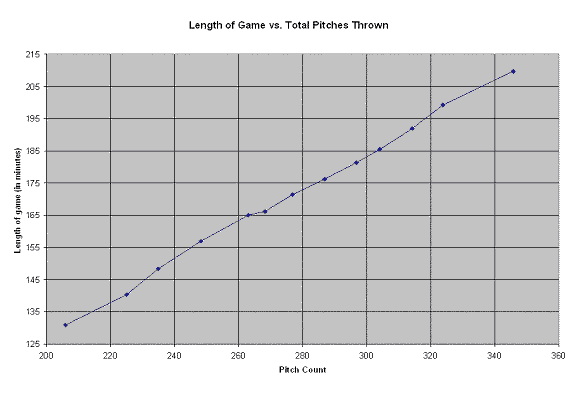
But what of the other supposed benefit of speeding up games? How much time
would we expect to be shaved off the average length of a game if we reduced
the pitch counts? Again, there’s a clear relationship between pitch counts
and the time it takes to play a nine-inning major-league game.

Shortening the time between innings and reducing the number of warmup tosses
a pitcher gets may help keep the game moving, but one of the best ways to
complete a game in less than three hours is to have pitchers who work
efficiently. Interpolating the data in the table again, cutting pitch counts
from 285 to 270 should knock about nine minutes off the length of a typical
nine-inning game, bringing the average down to a lean two hours, 47 minutes.
So, if you believe that a 5% reduction in game time, and a 17% reduction in
scoring, is a big change in the character of the game, then Nate’s
suspicions are a little off: reducing pitch counts would have a big effect
on baseball. Calling fractionally more strikes would single-handedly
counteract the offensive explosion of the mid-to-late 1990’s.
As usual, some big caveats apply to this analysis. First, I’m assuming that
since games around 285 pitches are an adequate model for a league that
averages 285 pitches, that a similar relationship exists for other offensive
and pitch-count levels. Second, I’m really analyzing the effect of games in
which the current umpiring style produced a certain percentage of strikes,
with a presumably random distribution of strikes within the strike zone. If
umpires change what they consider to be a strike (calling them strikes where
they used to be balls), the impact on the game could be considerably
different from the approximation used here. It’s the borderline pitches that
will change from balls to strikes, so you’re adding more strikes in a
decidedly non-random fashion. Since those pitches are probably harder to
hit, the batter may be put at even more of a disadvantage than shown here.
On the other hand, we’re also not considering how batters and pitchers might
react to the new strike zone. Would batters become more aggressive earlier
in the count, and drive pitch counts further down as a side effect, but
without actually lowering offense anymore than expected? Would pitchers and
catchers change how they work a batter, relying more on nibbling at the
fringes of a generous strike zone, and less on challenging them in a tiny
zone in the batter’s wheelhouse? How long would such a strike zone last?
Would pitchers, benefiting from lower workloads, get less tired between
starts, and be stronger in each outing than before? Is there a feedback
effect that would tip the scales more and more towards reduced run scoring,
or would there be counterbalances that would pull the game back towards
high-offense, long-running games?
While this analysis doesn’t provide answers to all of those questions, it
does suggest that the implications of even a 15-pitch reduction would be
significant, and thus changes towards that goal should not be taken lightly.
Keith Woolner is an author of Baseball Prospectus. You can contact him by
clicking here.
Thank you for reading
This is a free article. If you enjoyed it, consider subscribing to Baseball Prospectus. Subscriptions support ongoing public baseball research and analysis in an increasingly proprietary environment.
Subscribe now